プログラム実行時の命令数(関数単位)を可視化してみた
Intel Pinで任意のプログラム実行時の実行命令数を関数単位で計測し,d3.jsに食わせたという話.
背景
プログラム解析時に複雑で命令数が多いところはなるだけ読みたくない.
読むなら心構えがしたい.
一目でわかるようにできないかと思って可視化に手を出してみた,第一弾.
処理の流れ
まとめてしまうとこれだけ.大したことはしていない.
しかしd3.jsが曲者で時間を取られた.
実行環境
お決まりのやつ.
$ uname -a
Linux poppycompass 5.3.11-arch1-1 #1 SMP PREEMPT Tue, 12 Nov 2019 22:19:48 +0000 x86_64 GNU/Linux
$ gcc -v
(snip)
gcc version 9.2.0 (GCC)
Intel Pinで実行命令数の計測
まずはIntel Pinを準備.
    $ wget https://software.intel.com/sites/landingpage/pintool/downloads/pin-3.11-97998-g7ecce2dac-gcc-linux.tar.gz
    $ tar xvf pin-3.11-97998-g7ecce2dac-gcc-linux.tar.gz
    $ cd pin-3.11-97998-g7ecce2dac-gcc-linux.tar.gz
    $ cd source/tools/ManualExamples/
    $ make all TARGET=intel64
    $ ../../../pin -t obj-intel64/inscount0.so -- /bin/ls # inscount0は全体で何命令実行されたかのカウントするプログラム
    $ cat insount0.out
     Count 650939
カウント数が出ればOK.
関数単位での実行命令数を出力するプログラムを組もうと思いきや,proccount.cppがまさにそれだった.
流石インテル入ってる.
そのままだと目に優しいテキストとして出力されるから,CSV出力にいじった.
全部を載せると長いからいじったFini関数のところのみ抜粋.空白を消して,が入るようにしただけ.
// This function is called when the application exits
// It prints the name and count for each procedure
VOID Fini(INT32 code, VOID *v)
{
    outFile <<  "Procedure" << ","
            <<  "Image" << ","
            <<  "Address" << ","
            <<  "Calls" << ","
            <<  "Instructions" << endl;

    for (RTN_COUNT * rc = RtnList; rc; rc = rc->_next)
    {
        if (rc->_icount > 0)
            outFile << rc->_name << ","
                    << rc->_image << ","
                    << hex << rc->_address << dec <<","
                    << rc->_rtnCount << ","
                    << rc->_icount << endl;
    }

}
計測対象は簡単のためにHello Worldとした.
以下を適当なファイルに保存する.
// hello.c
#include <stdio.h>

int main(void)
{
    puts("hello");
    return 0;
}
$ gcc hello.c
$ ./a.out
hello
これで準備は整った. データを取る.
$ ../../../pin -t obj-intel64/proccount.so -- ./a.out
hello
$ cat proccount.out
Procedure,Image,Address,Calls,Instructions
__strlen_avx2,libc.so.6,7fe200f906e0,1,16
__strrchr_avx2,libc.so.6,7fe200f90510,1,28
_dl_addr,libc.so.6,7fe200f67de0,1,66742
__init_misc,libc.so.6,7fe200f2e130,1,25
sbrk,libc.so.6,7fe200f25190,2,51
(snip)
Intel Pinでやることはここまで.
CSVをJSONに変換
可視化で見たいものは実行命令数の大小.
棒グラフでも良かったがここではバブルチャートを使うことにした.
d3.jsに食わせるにはJSON形式のほうが都合が良さそうだったから変換する.
スクリプトを書いただけ.
#!/usr/bin/env python
# -*- coding: utf-8 -*-
# file: csv2json.py

import json
import csv

CSV_FILE = "proccount.csv"
JSON_FILE = "proccount.json"


def all_in_one():
    json_contents = {}
    children = []
    with open(CSV_FILE, 'r') as f:
        for row in csv.DictReader(f):
            children.append(
                    {"name": row["Procedure"],
                     "size": row["Instructions"]})
    with open(JSON_FILE, 'w') as f:
        json_contents["name"] = "execute"
        json_contents["children"] = children
        json.dump(json_contents, f)

def each_image():
    json_contents = {}
    children = {}
    with open(CSV_FILE, 'r') as f:
        for row in csv.DictReader(f):
            if not row["Image"] in children:
                children[row["Image"]] = []

            children[row["Image"]].append(
                    {"name": row["Procedure"],
                     "size": row["Instructions"]})
    with open(JSON_FILE, 'w') as f:
        for (key,val) in zip(children.keys(), children.values()):
            json_contents = {}
            json_contents["Image"] = key
            json_contents["children"] = val
            json.dump(json_contents, f)
            f.write('\n')

if __name__ == '__main__':
    all_in_one()
Intel Pinの出力はどのファイル内にある関数かも記録してある.それぞれを取り出すための関数がeach_image,ファイル関係なくまとめたのがall_in_one.
$ python csv2json.py
$ cat proccount.json
{"name": "execute", "children": [{"name": "__strlen_avx2", "size": "16"}, {"name": "__strrchr_avx2", "size": "28"}, {"name": "_dl_addr", "size": "66742"}, {"name": "__init_misc", "size": "25"}
(snip)
データの準備もこれで完了
加工したデータをバブルチャートで表示
バブルチャートのサンプルを取ってきたらほぼそのまま使えた.
以下はindex.html.
<!DOCTYPE html>
<html>

<head>
  <meta charset="utf-8">
  <title>D3 v5 hierarchy pack v4/v5</title>
</head>

<body>
  <svg width="800" height="600"></svg>
  <script src="https://d3js.org/d3.v4.min.js"></script>
  <script src="graph.js"></script>
</body>
</html>
// graph.js
var diameter = 960,
    format = d3.format(",d"),
    color = d3.scaleOrdinal(d3.schemeCategory20c);

var bubble = d3.pack()
    .size([diameter, diameter])
    .padding(1.5);

var svg = d3.select("body").append("svg")
    .attr("width", diameter)
    .attr("height", diameter)
    .attr("class", "bubble");

d3.json("proccount.json", function(error, data) {
  if (error) throw error;

  var root = d3.hierarchy(classes(data))
      .sum(function(d) { return d.value; })
      .sort(function(a, b) { return b.value - a.value; });

  bubble(root);
  var node = svg.selectAll(".node")
      .data(root.children)
    .enter().append("g")
      .attr("class", "node")
      .attr("transform", function(d) { return "translate(" + d.x + "," + d.y + ")"; });

  node.append("title")
      .text(function(d) { return d.data.className + ": " + format(d.value); });

  node.append("circle")
      .attr("r", function(d) { return d.r; })
      .style("fill", function(d) {
        return color(d.data.packageName);
      });

  node.append("text")
      .attr("dy", ".3em")
      .style("text-anchor", "middle")
      .text(function(d) { return d.data.className.substring(0, d.r / 3); });
});

// Returns a flattened hierarchy containing all leaf nodes under the root.
function classes(root) {
  var classes = [];

  function recurse(name, node) {
    if (node.children) node.children.forEach(function(child) { recurse(node.name, child); });
    else classes.push({packageName: name, className: node.name, value: node.size});
  }

  recurse(null, root);
  return {children: classes};
}

d3.select(self.frameElement).style("height", diameter + "px");
今回はローカルにあるproccount.jsonを読み込むため,通常のブラウザだとCORS関連で弾かれる.
これはブラウザ起動時にオプションをつければ良い.
$ google-chrome-stable --allow-file-access-from-files --disable-web-security --user-data-dir --disable-features=CrossSiteDocumentBlockingIfIsolating
開いたブラウザからfile://パス/index.htmlへアクセスする.
結果
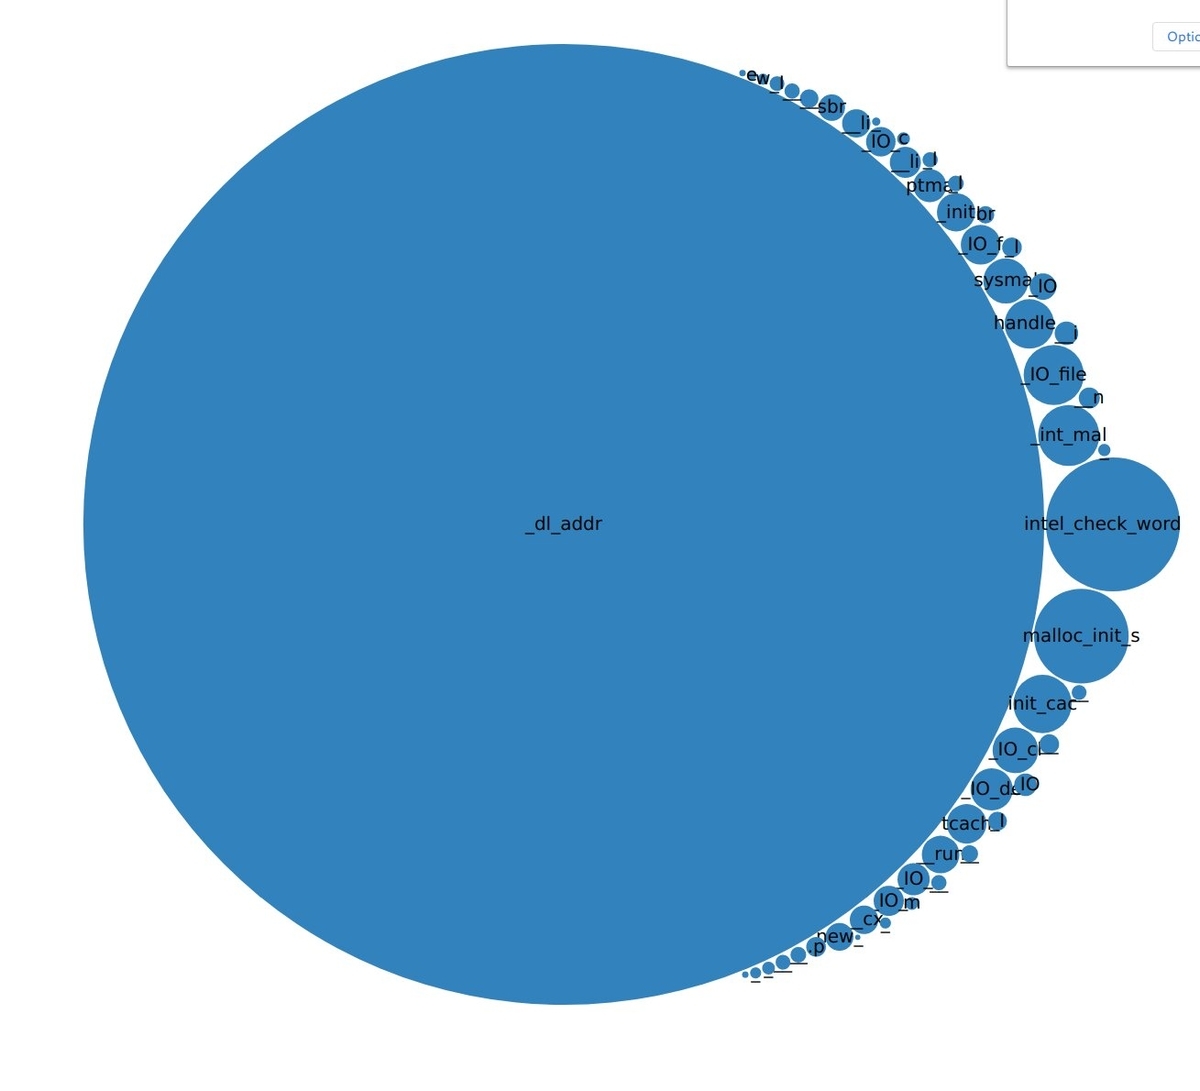
 メイン処理と全く関係ないところが非常に大きな比重を占めていることがひと目でわかる.
そりゃmain部なんてprintfしてるだけだからこの図じゃわかるわけなかった.
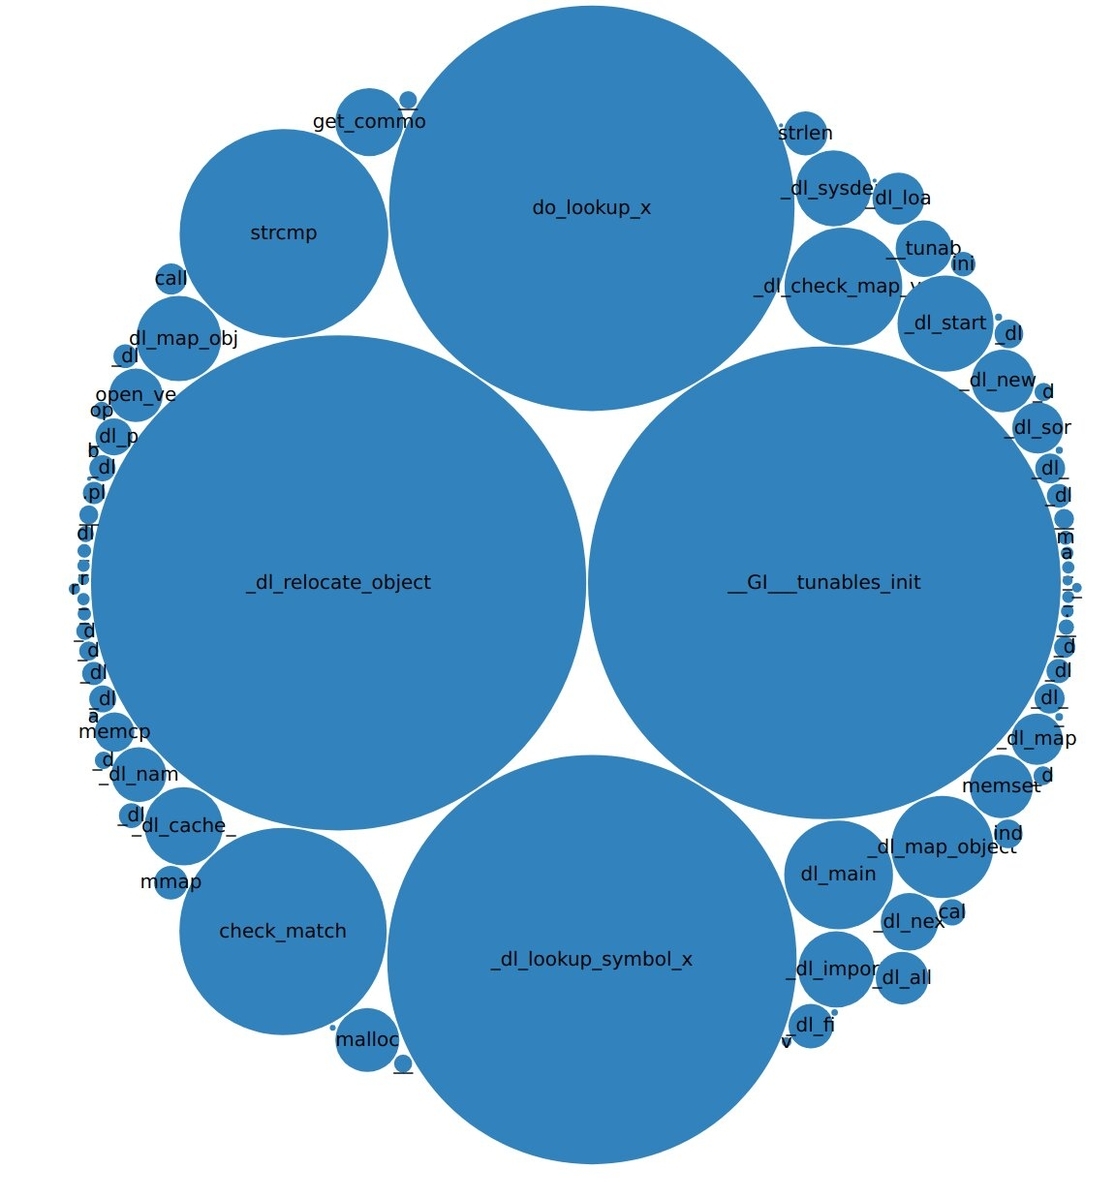
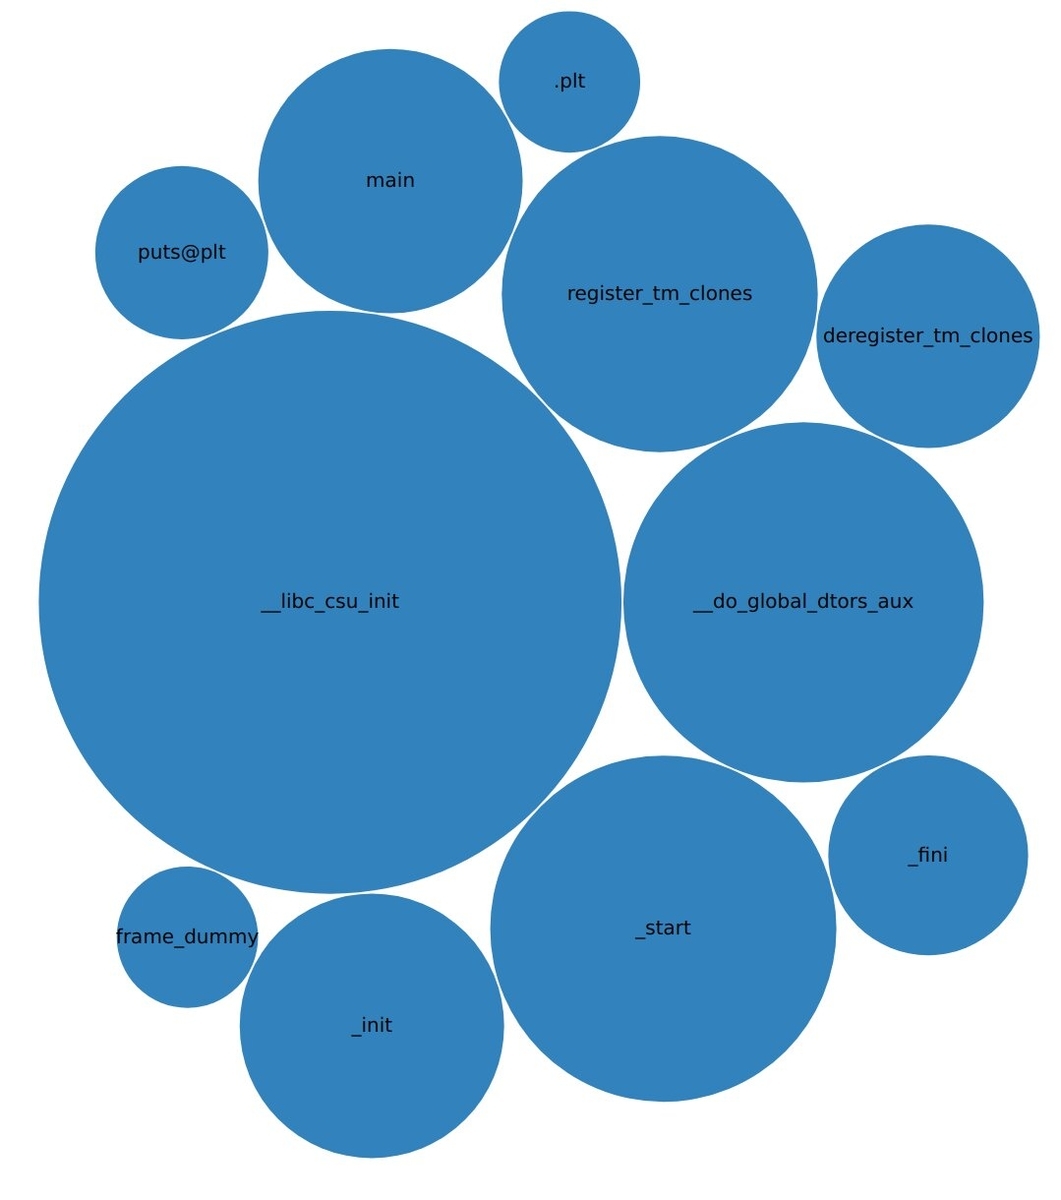
これだけだともやもやするからファイル毎の関数で可視化してみた(前述のeach_imageを利用).
each_imageの出力は各ファイル単位で改行されるから,見たいやつ以外の行を消すこと.
以下,libc.so.6,ld-linux-x86-64.so.2,a.outの結果.


バブルの大きさは各ファイルの命令数の平均に影響されている.a.outのmainは7命令だけど結構大きくなってしまっている.
所感
命令数が多い=重要な関数かと言われると実行準備段階の命令も入っているから一概に言えない.
処理を追う上では流れの関係を示さなければ役には立たなさそうだ.
d3.jsってエクセルの3Dマップのように球体表示し,ドラッグドロップで後ろまで見えるかと思っていたが,そこまでの機能はないようだ.
可視化はあくまでネットワーク図のように繋がりを一目で表現するためのものでCADみたいな3Dツールとは別物なんだと知った.
ごちゃごちゃ書いたが結局これだけだと解析にはイマイチ使えない.
次の方法を考えないといけない.
参考
Bubble Chart d3 v4 - bl.ocks.org